Research
Dr. Kamenetsky’s research develops statistical and epidemiologic methods to understand how complex environmental and lifestyle exposures jointly influence cancer risk and other chronic diseases. She integrates Bayesian modeling, spatial epidemiology, and population health data science to identify harmful exposure patterns, account for geographic dependencies, and generate actionable evidence for cancer prevention and public health decision-making.
Bringing spatial confounding into the causal inferential fold
Alexander P. Keil and Maria E. Kamenetsky (American Journal of Epidemiology, invited commentary, in press)
Spatial patterning of environmental hazards often leads to concerns about spatial confounding: that the exposures we study share similar spatial distributions with other causes of disease. Recent efforts to address spatial confounding have approached it using clever specification of spatial models, or models that adjust for aspects of spatial location itself. In the article by Li et al. (Am J Epidemiol. XXXX;XXX(XX):XXXX–XXXX)), the authors describe and demonstrate several models for addressing spatial confounding for binary exposures. These important results demonstrate an aspect of environmental exposures that should concern all environmental epidemiologists: inadequate adjustment for spatial confounding can increase, rather than decrease, bias from spatial confounding. In this commentary, we disagree with some terminology and enthusiastically agree with the importance of the problem and the utility of the approaches described by these authors. Causal inference in environmental epidemiology is fraught with many challenges, and Li et al. give hope for progress on one of the lesser understood, yet potentially ubiquitous, problems: spatial confounding.
Spatial and spatio-temporal cluster detection using stacking
Maria E. Kamenetsky, Jun Zhu, Ronald E. Gangnon (Spatial Statistics, Volume 70, December 2025)

Patterns in disease across space and time are important to epidemiologists and health professionals because they may indicate underlying elevated disease risk. In some cases, elevated risk may be driven by environmental exposures, infectious diseases or other factors where timely public health interventions are important. The spatial and spatio-temporal scan statistics identify a single most likely cluster or equivalently select a single correct model. We instead consider an ensemble of single cluster models. We use stacking, a model-averaging technique, to combine relative risk estimates from all of the single cluster models into a sequence of meta-models indexed by the effective number of parameters/clusters. The number of parameters/spatio-temporal clusters is chosen using information criteria. A simulation study is conducted to demonstrate the statistical properties of the stacking method. The method is illustrated using a dataset of female breast cancer incidence data at the municipality level in Japan.
(Re-)match: adjusting for matching factors in case-control studies may be unnecessary or insufficient
Maria E. Kamenetsky and Alexander P. Keil (American Journal of Epidemiology, 2025, in press)
Case-control studies are often matched, such that controls without the disease are selected to be similar to cases on certain characteristics (e.g. age), known as matching factors. Matching can improve cost- and time-efficiency in case-control studies relative to cohort studies by making the marginal distribution of matching factors the same between cases and controls. Most common rules-of-thumb around matched case-control studies recommend to always adjust for matching factors in analysis because they are presumed to be confounders. However, guidance is incomplete when matching factors are not confounders. We use directed acyclic graphs (DAGs) and simple simulation study to illustrate how general guidance for addressing bias can break down when the exposure of interest is no longer a confounder in three scenarios. We demonstrate that in contrast to current guidance, it is not always appropriate to simply adjust for matching factors because it can be unnecessary and sometimes leaves residual bias. Matching factors need not necessarily be included in the analysis when matching variables may not be confounders or when the disease is rare. We make the novel observation that the choice to adjust in these scenarios is based on the logistic model misspecification related to non-collapsibility of the odds ratio, which is informed by DAGs. Thus, strict reliance on traditional rules of confounding without considering the tools of inference or causal considerations can be misleading in case-control studies. Our recommendations to epidemiologists who analyze matched case-control studies are two-fold: 1) to minimize bias use DAGs to inform about confounding and the existence of variables that may be important for model specification and 2) to reduce variance when DAGs cannot be specified with much certainty, default to the practice of always adjusting for matching factors unless the disease is rare in all observed strata of covariates and exposure.

Partial Effects in Environmental Mixtures—Evidence and Guidance on Methods and Implications
Maria E. Kamenetsky, Barrett M. Welch, Paige A. Bommarito, Jessie P. Buckley, Katie M. O’Brien, Alexandra J. White, Thomas F. McElrath, David E. Cantonwine, Kelly K. Ferguson, and Alexander P. Keil (Environmental Health Perspectives, 2025)
Background: The effects of a mixture of exposures on health outcomes are of interest to public health, but pose methodological hurdles. These exposures may impact the outcome in opposing ways, which we call the positive and negative partial effects of a mixture. There has been growing interest in estimating these partial effects and their ability to inform public health interventions.
Objectives: Methods like quantile g-computation (QGC) and weighted quantile sums regression (WQSr) were originally developed for estimating an overall mixture effect. These approaches, however, have not been comprehensively evaluated in their ability to estimate partial effects. We study the bias-variance tradeoffs of these approaches in estimating partial effects.
Methods: We compare QGC and WQSr with sample-splitting (QGCSS, WQSSS) and new methods including: 1) QGC and WQS a priori (QGCAP, WQSAP), which use prior knowledge to determine the positive and negative exposures prior to partial effects estimation; 2) model-averaging (QGC-MA); 3) elastic net to determine the split (QGC-Enet). We also considered WQSr with no sample-splitting (WQSNS), repeated holdout sets (RH-WQS), and two-index model with penalized weights (WQS2i). We compared performance under: 1) exposure correlations; 2) varying sample sizes; 3) spread in the negative effect across exposures; 4) imbalance in the partial effects.
Results: Our simulation results showed that the estimation of negative and positive partial effects grows in root mean squared error and average bias as correlation amongst exposures increases, sample sizes shrink, the negative effect is spread over more exposures, or the imbalance between the negative and positive effects increases. Our results are demonstrated in two examples of mixtures in relation to oxidative stress biomarkers and telomere length.
Discussion: Outside of having a priori knowledge, no method is optimally reliable for estimating partial effects across common exposure scenarios. We provide guidance for practitioners of when partial effects might be most accurately estimated under particular settings. https://doi.org/10.1289/EHP14942
The Role of Neighborhood in Individual and Disparity-Level Factors and Birth Weight in Dane County, Wisconsin
Maria E. Kamenetsky, Erin Bailey, Alexa Lowry, Ronald Gangnon, Brian Stafeil, Kara Hoppe (Wisconsin Medical Journal, 2024)
There are significant disparities in the rates of maternal and infant morbidity and mortality in the United States – a discrepancy of particular importance in Wisconsin, where Non-Hispanic Black women experience the highest mortality rates in the country. The adverse effects of neighborhood socioeconomic status and geographical distance to obstetrical care outcomes have been demonstrated previously, with poor neighborhood socioeconomic status having been linked to higher rates of preterm births and low birth weight infants, which both increase the risk of neonatal morbidity and mortality. The objective of this study was to investigate the contributions of Area Deprivation Index and geographic location on age-matched birth weight z-scores.
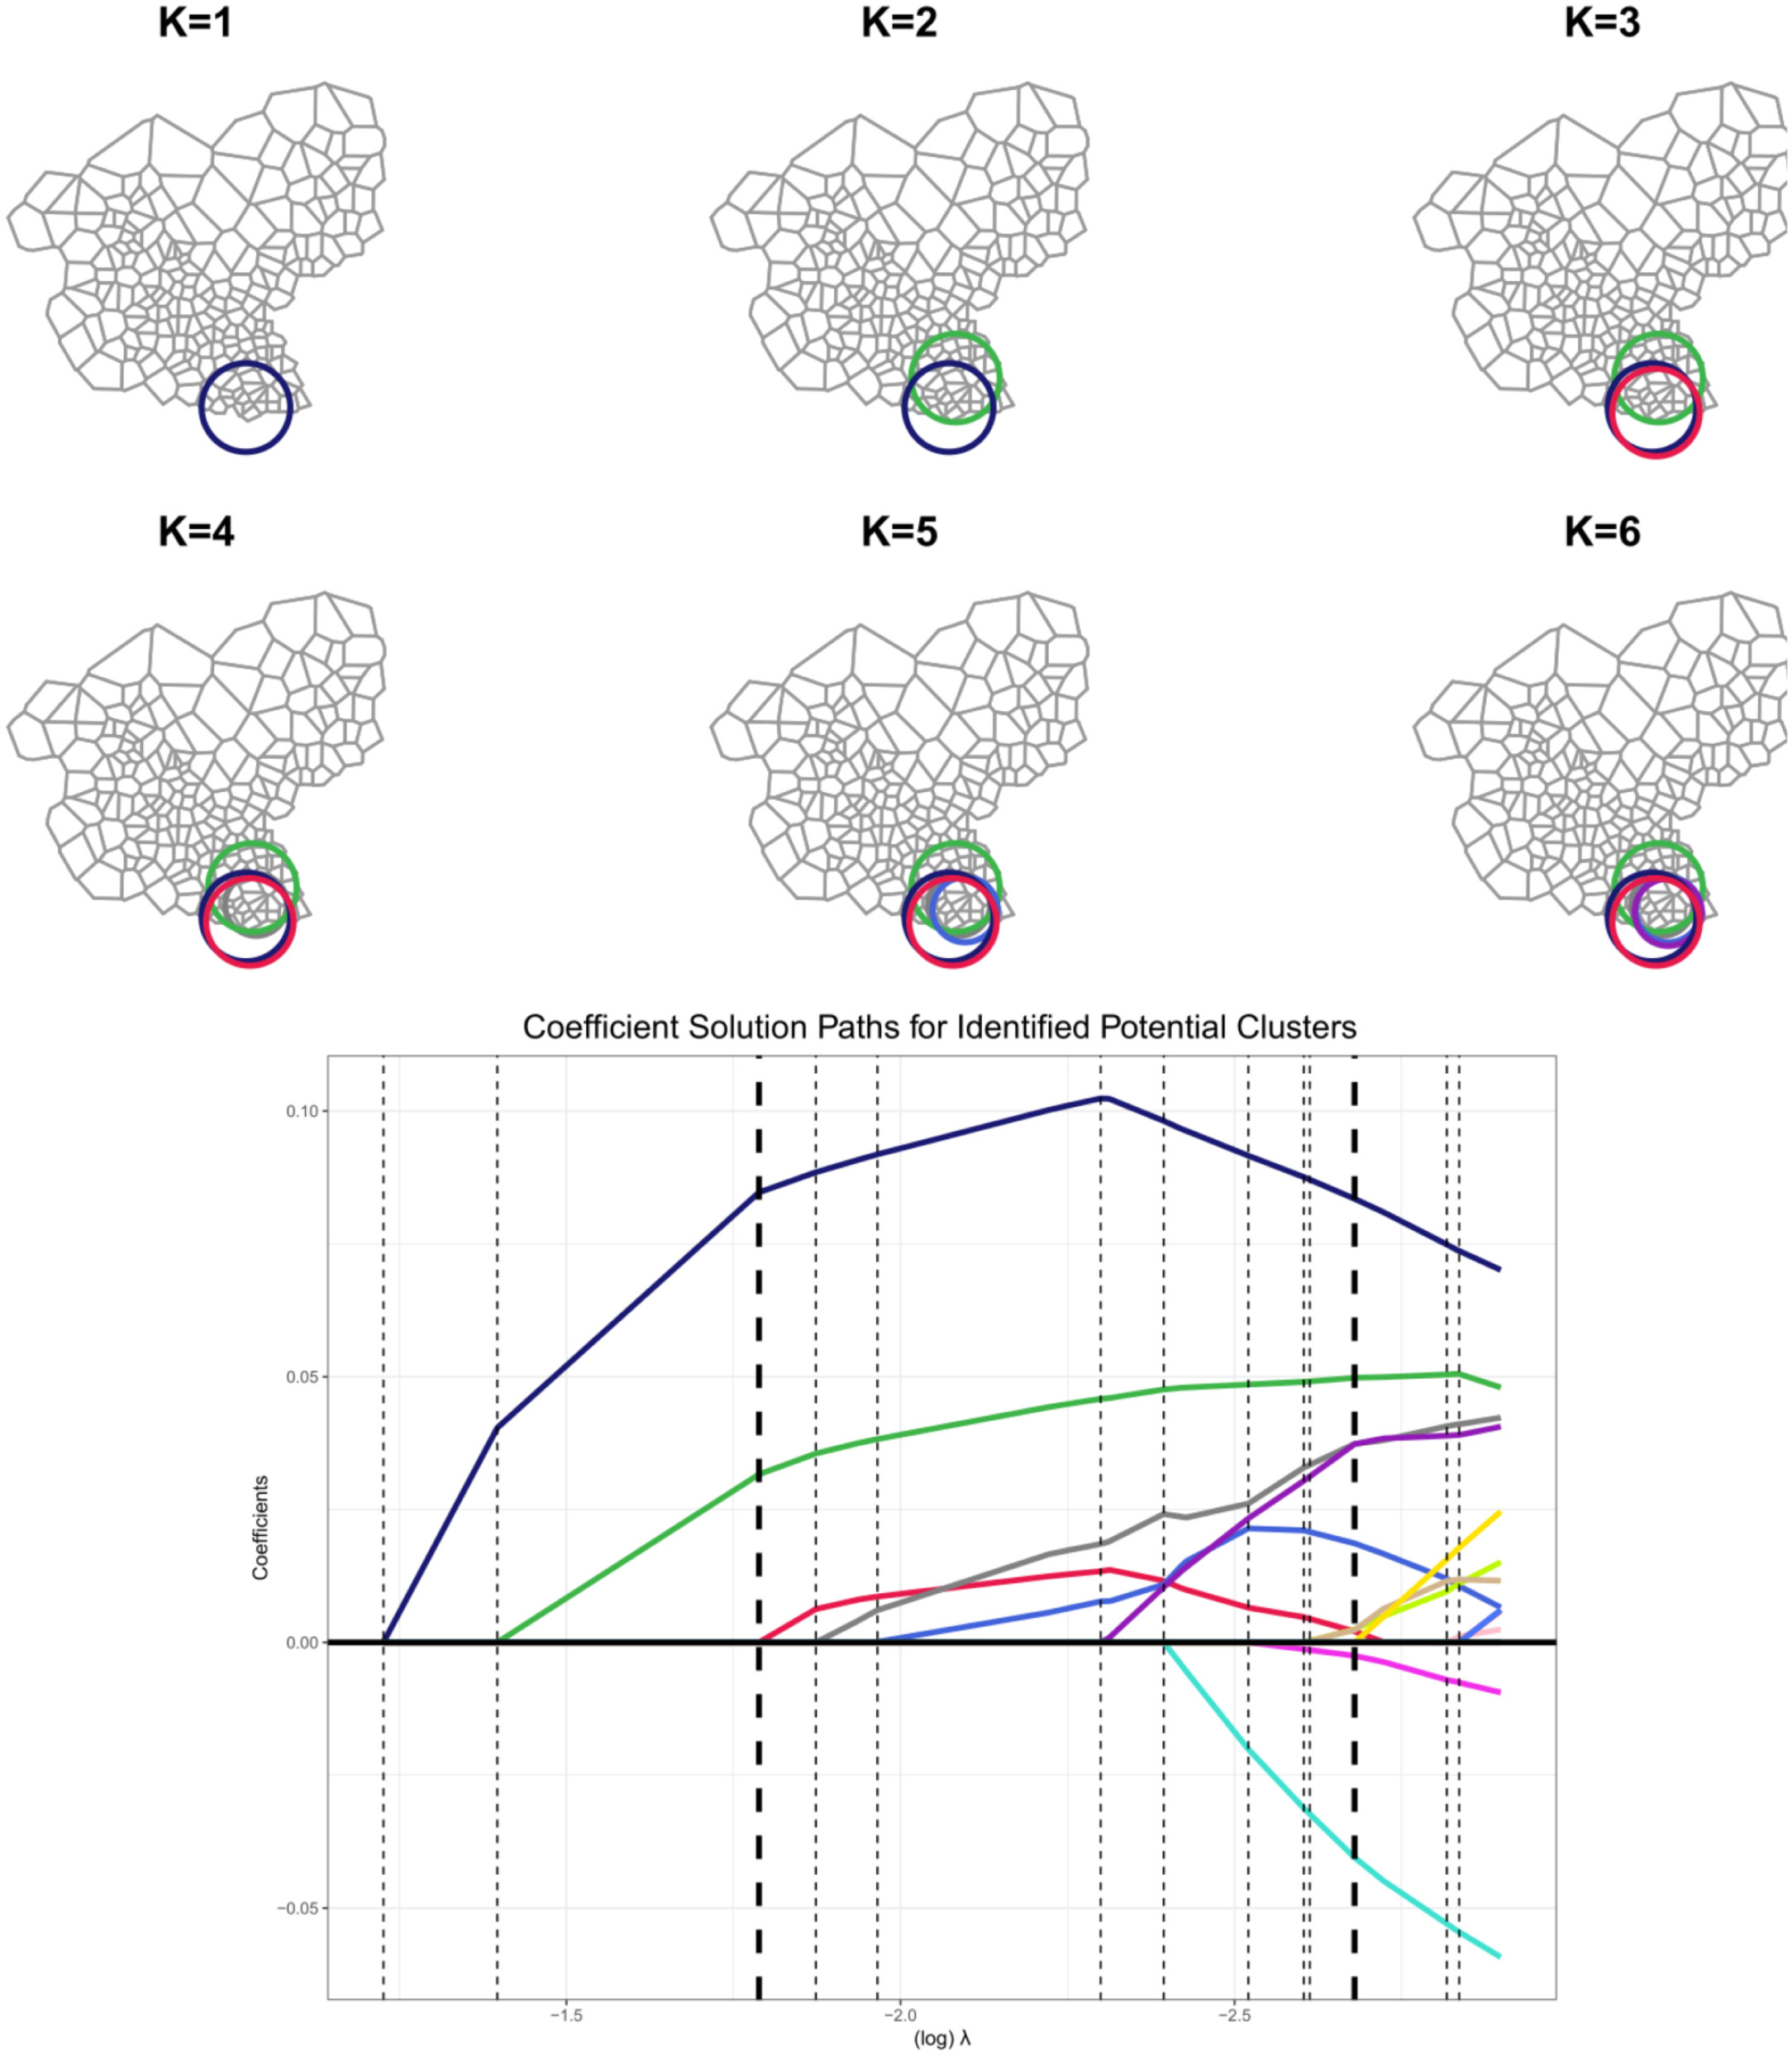
A Flexible Method for Identifying Spatial Clusters of Breast Cancer Using Individual-Level Data
Maria E. Kamenetsky, Amy Trentham-Dietz, Polly Newcomb, Jun Zhu, Ronald Gangnon (Annals of Epidemiology, 2022)
Prior research has shown that cancer risk varies by geography, but scan statistic methods for identifying cancer clusters in case-control studies have been limited in their ability to identify multiple clusters and adjust for participant-level risk factors. We develop a method to identify geographic patterns of breast cancer odds using the Wisconsin Women’s Health Study, a series of 5 population-based case-control studies of female Wisconsin residents aged 20-79 enrolled in 1988-2004 (cases=16,076, controls=16,795). We create sets of potential clusters by overlaying a 1 km grid over each county-neighborhood and enumerating a series of overlapping circles. Using a two-step approach, we fit a penalized binomial regression model to the number of cases and trials in each grid cell, penalizing all potential clusters by the least absolute shrinkage and selection operator (Lasso). We use BIC to select the number of clusters, which are included in a participant-level logistic regression model. We identify 15 geographic clusters, resulting in 23 areas of unique geographic odds ratios. After adjustment for known risk factors, confidence intervals narrowed but breast cancer odds ratios did not meaningfully change; one additional hotspot was identified. By considering multiple overlapping spatial clusters simultaneously, we discern gradients of spatial odds across Wisconsin.
Regularized spatial and spatio-temporal cluster detection
Maria E. Kamenetsky, Junho Lee, Jun Zhu, Ronald Gangnon (Spatial and Spatio-Temporal Epidemiology, 2022)
Spatial and spatio-temporal cluster detection are important tools in public health and many other areas of application. Cluster detection can be approached as a multiple testing problem, typically using a space and time scan statistic. We recast the spatial and spatio-temporal cluster detection problem in a high-dimensional data analytical framework with Poisson or quasi-Poisson regression with the Lasso penalty. We adopt a fast and computationally-efficient method using a novel sparse matrix representation of the effects of potential clusters. The number of clusters and tuning parameters are selected based on (quasi-)information criteria. We evaluate the performance of our proposed method including the false positive detection rate and power using a simulation study. Application of the method is illustrated using breast cancer incidence data from three prefectures in Japan.
Tutorials supplement
“Regularized spatial and spatio-temporal cluster detection” (in press) and are associated with the clusso R package, which can be found
here.
Using clusso with case-control data
Clustered Spatio-Temporal Varying Coefficient Regression Model
Junho Lee, Maria E. Kamenetsky, Ronald Gangnon, Jun Zhu (Statistics in Medicine, 2021)
In regression analysis for spatio-temporal data, identifying clusters of spatial units over time in a regression coefficient could provide insight into the unique relationship between a response and covariates in certain subdomains of space and time windows relative to the background in other parts of the spatial domain and the time period of interest. In this article, we propose a varying coefficient regression method for spatial data repeatedly sampled over time, with heterogeneity in regression coefficients across both space and over time. In particular, we extend a varying coefficient regression model for spatial-only data to spatio-temporal data with flexible temporal patterns. We consider the detection of a potential cylindrical cluster of regression coefficients based on testing whether the regression coefficient is the same or not over the entire spatial domain for each time point. For multiple clusters, we develop a sequential identification approach. We assess the power and identification of known clusters via a simulation study. Our proposed methodology is illustrated by the analysis of a cancer mortality dataset in the Southeast of the U.S.
Tutorials supplement
“Clustered Spatio-Temporal Varying Coefficient Regression Model” (2021) and are associated with the coefclust package, which can be found
here.
Spatio-Temporal Analysis using coefclust
Spatial Regression Analysis of Poverty in R
Maria Kamenetsky, Guangqing Chi, Donghui Wang, Jun Zhu (Spatial Demography, 2019)
Poverty has been studied across many social science disciplines, resulting in a large body of literature. Scholars of poverty research have long recognized that the poor are not uniformly distributed across space. Understanding the spatial aspect of poverty is important because it helps us understand place-based structural inequalities. There are many spatial regression models, but there is a learning curve to learn and apply them to poverty research. This manuscript aims to introduce the concepts of spatial regression modeling and walk the reader through the steps of conducting poverty research using R: standard exploratory data analysis, standard linear regression, neighborhood structure and spatial weight matrix, exploratory spatial data analysis, and spatial linear regression. We also discuss the spatial heterogeneity and spatial panel aspects of poverty. We provide code for data analysis in the R environment and readers can modify it for their own data analyses. We also present results in their raw format to help readers become familiar with the R environment.
The tutorials below supplement
“Spatial Regression Analysis of Poverty in R” (2019) by Kamenetsky, Chi, Wang, and Zhu (Spatial Demography, 2019). The SpatialRegPovertyR repository for these tutorials can be found
here.
Predictive Enforcement of Pollution and Hazardous Waste Violations in New York State - Data Science for Social Good
Eric Potash, Jimmy Jin, Maria Kamenetsky, Dean Magee, Paul van der Boor, Rayid Ghani (2016)
The improper treatment and disposal of hazardous waste can have disastrous effects on the environment and human health. The Resource Conservation and Recovery Act (RCRA) governs hazardous waste management in the United States. To enforce its regulations, the New York State Department of Environmental Conservation (NYSDEC) inspects facilities that handle hazardous materials. However, due to resource constraints, not all facilities can be inspected each year. We worked with NYSDEC to build predictive models that use reporting, monitoring, and enforcement data to prioritize inspection resources.
Details on the project and conference video can be found here.
Predictive Modeling for Environmental Protection: Hazardous Waste Management , can be found here .